Profile the code
Identify the 3% critical code that needs to be optimized.
97% of the time: premature optimization is the root of all evil.
A CPU profile
A CPU profile identifies the functions whos execution requires the most CPU time.
go test -cpuprofile=cpu.out
A heap profile
A heap profile identifies the statements responsible for allocating the most memory.
go test -memprofile=mem.out
A blocking profile
A blocking profile identifies the operations responsible for blocking goroutines the longest, such as system calls, channel sends and receives, and acquisitions of locks.
go test -blockprofile=block.out
Runtime profile
Go runtime’s profiling features can be enabled under programmer control using the runtime API.
Analize profile with pprof tool
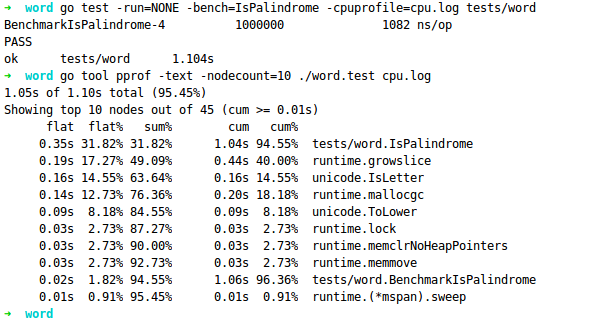
Once we’ve gathered a profile, we need to analyze it using the pprof tool.
go tool pprof
Summary
// the benchmark test are disabled with NONE
go test -run=NONE -bench=ClientServerParallelTLS64 -cpuprofile=cpu.log net/http
go tool pprof -text -nodecount=10 ./http.test cpu.log
Example
the path to the package to profile is src/tests/word